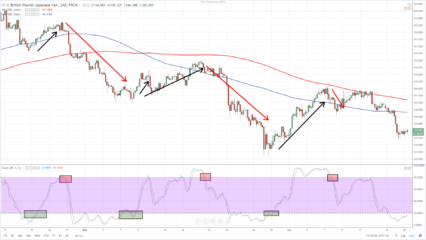
This trading strategy is based on the oversold or overbought of a given financial instrument. In our example, we will use the GBP / JPY cross, because the British pound against the Japanese yen is known for its volatility and larger movements.
To measure the mentioned parameters, we will use a technical oscillator Stochastics, which we will set to parameters 28,3,3, ie to a slower base, in order to filter out as many false signals as possible.
We choose a time frame of 240 minutes, ie four hours, so that we can capture larger movements on this currency pair.
We will enter long positions (ie buy) when both Stochastics curves fall from values below 20 back above 20. This may signal that the market is oversold and is ripe for an upward correction, as investors are likely to close short positions and the market will therefore receive purchases that could suppress the price upwards.
As we can see in the chart, we would record three buying positions, all of which would end up in profit as the market picked upwards.
Otherwise, we will sell (ie short-circuit) when both Stochastics curves get back from below 80 below 80. This may signal that the market is overbought and is ripe for a downward correction, as investors are likely to start closing long positions and the market will therefore receive sales that could push the price down.
As we can see in the chart, we would realize three sales positions and even here they would all end up in profit, because the market went down.
Since it is a more volatile instrument, it is necessary to choose a larger stop loss, e.g. 100 pips, while the withdrawal of profit should be made at 150-200 pips, or if the position is in profit, slowly move the Stop loss and do not use the Take profit order. In the case of greater movement, the potential for profit is much greater.
However, it is important to kept mind that even this strategy is not infallible and in some cases may not work.
This strategy is also suitable for beginners.


