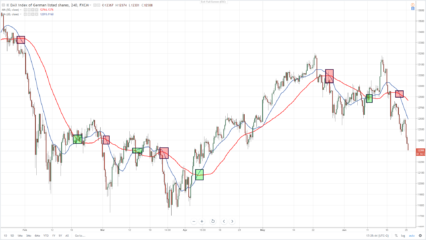
Ez a stratégia két mozgóátlag kereszteződésén alapul. A piros mozgóátlag periódusa 50, és lassabb, míg a kék mozgóátlag periódusa 20, és gyorsabb. Pénzügyi eszközként ebben a példában a német tőzsdeindexet, a DAX-ot használtuk, és a grafikon időintervalluma négy óra. Ez a stratégia más eszközökre vagy időszakokra is alkalmazható.
A stratégia alapelve, hogy eladni akkor kell, amikor a gyorsabb átlag felülről lefelé keresztezi a lassabb átlagot (a grafikonon piros jelölésekkel), és venni akkor, amikor a gyorsabb átlag alulról felfelé keresztezi a lassabb átlagot (a grafikonon zöld jelölésekkel).
A stratégia előnye, hogy képes megragadni a grafikonokon megjelenő nagyobb trendeket is, ami jelentős profitot eredményezhet. A stratégia hátránya éppen az oldalazó kereskedés során jelentkezik, amikor több fals jelzés is előfordulhat.
A pozíciókat a négyórás gyertya lezárása után és a következő négyórás gyertya megnyitása során kell megnyitni, ha a mozgóátlagok kereszteződése megtörténik (a grafikonon láthatók az egyes mozgóátlagok értékei, így azok könnyen leolvashatók). A DAX esetében legalább 100 pontos stop loss javasolt, míg a Take Profit háromszáz pont lehet. Ugyanakkor érdemes a Stop Losst mozgatni (úgynevezett Trailing Stop), például 100 pontos nyereség elérése után.
A grafikon több pozíciót mutat, öt eladást, amelyek közül négy nyereséggel zárult. Négy vételi pozíció lenne, és legalább három nyereséggel végződne, egy pedig körülbelül nullában – feltételezve a stop loss mozgatását.
Ez a stratégia haladó kereskedők számára alkalmas.


