Warning on risks: Financial contracts for difference are complex instruments and are associated with a high risk of rapid financial losses due to leverage. On 77.44% of retail investor accounts, financial losses occur when trading financial contracts for difference with this provider. You should consider whether you understand how financial contracts for difference work, and whether you can afford to take the high risk of suffering financial losses. Please read the Risk Disclosures.

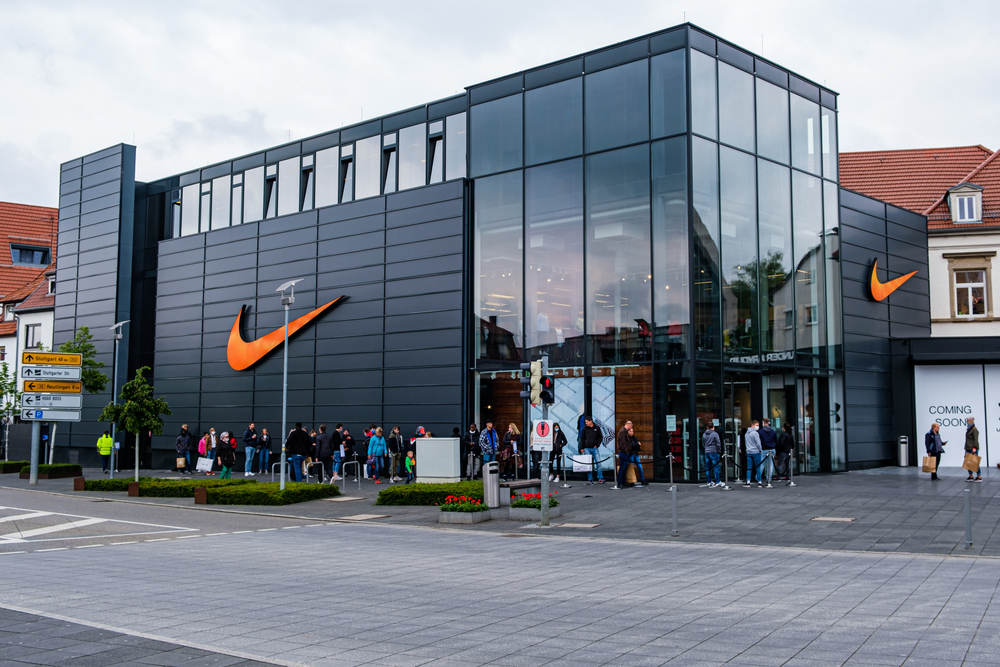
Nike: Higher Margin Did Not Stop the Decline in Revenue or Shares
About the company
Nike, Inc. is a U.S. company headquartered in Beaverton, Oregon, that develops, manufactures through supplier partners, and sells athletic footwear, apparel, and equipment. Its portfolio includes the Nike, Jordan, and Converse brands. It distributes products through its own stores, digital platforms, and wholesale partners. In fiscal 2026, it generated revenue of $46.4 billion and employed approximately 73,000 people at the end of May. It serves customers in approximately 190 countries. Class B shares are traded on the New York Stock Exchange under the ticker NKE.
Results revealed a gap between margin and demand
Nike reported financial results on October 1, 2026, for the first quarter of fiscal 2027, which ended on August 31. Revenue reached $11.21 billion, down 4% year on year, or 5% on a currency-neutral basis. Net income declined from $727 million to $712 million, while diluted earnings per share fell from $0.49 to $0.48. Gross margin nevertheless increased by 0.6 percentage points to 42.8%. The shares closed trading on October 9 at $34.71, approximately three quarters lower than five years ago*. Continued pressure on revenue and the share valuation therefore creates a challenging starting point for management’s transformation plan.
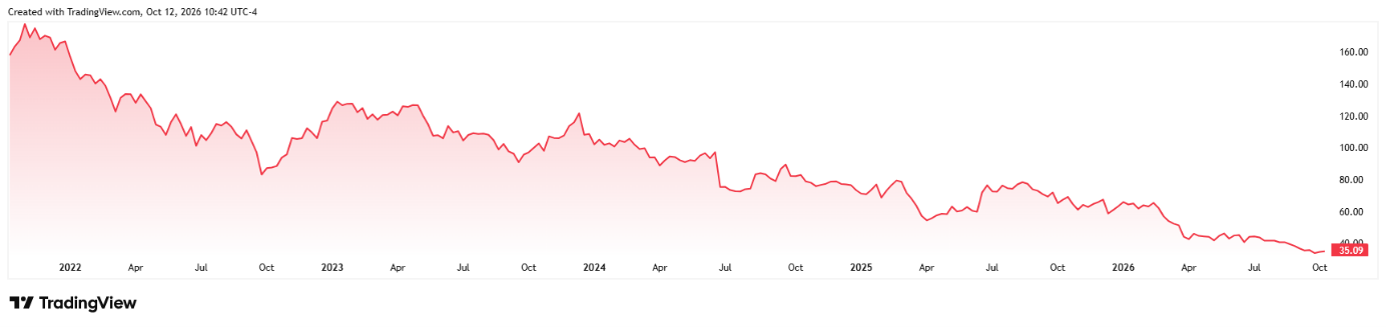
Nike Share Price Performance Over the Past Five Years*
Higher margin did not prevent gross profit from declining
For the quarter under review, Nike generated gross profit of $4.80 billion compared with $4.94 billion a year earlier. The year-on-year decline of approximately 3% contrasts with the increase in gross margin from 42.2% to 42.8%. The largest positive impact came from lower warehousing and logistics costs, which increased margin by approximately 0.9 percentage points. Currency effects, including hedging activities, added another 0.4 points. Higher discounts and changes in the distribution channel mix, by contrast, reduced average selling prices. Nike therefore earns higher gross profit from every dollar of revenue, but the decline in revenue volume reduced its total value. Spending to support demand, including marketing and sports activities, also increased by 5% to $1.25 billion. Further profitability developments will also depend on volumes sold and pricing discipline. [2]
North American wholesale is growing; China is losing volume
Regional data show a difference between the recovery in distribution and the recovery in consumer demand. In North America, revenue increased by 2% on a currency-neutral basis, while wholesale sales rose by 9%. Direct sales through owned stores and digital channels declined by 6%. Higher shipments to retail partners therefore do not yet demonstrate an equally strong increase in purchases by end customers. In Greater China, Nike recorded a 26% decline in revenue at constant exchange rates and a 34% decrease in segment earnings before interest and taxes. The number of pairs of footwear sold fell by 26%, while the average price per pair remained approximately unchanged. The weakness is therefore strongly related to sales volume. The Chinese market also recorded declines in both direct and wholesale sales. Developments in North American distribution therefore do not provide a sufficient basis for assuming a similar recovery in China.
Cash flows reveal the demands of the transformation
Nike’s operating cash flow for the first quarter reached $135 million, compared with $222 million a year earlier. With capital expenditure of $199 million, free cash flow was approximately negative $64 million. The company also paid $610 million in dividends and did not conduct share repurchases during the period. A single quarterly figure is not sufficient to assess long-term liquidity, as cash flows are affected by working capital movements and the timing of payments. At the end of August, however, inventories reached $7.85 billion, approximately 5% more than at the end of May. Higher inventory levels increase the importance of effectively managing older collections if the company is to launch new products without further pressure on discounts. Cash and short-term investments together amounted to $8.4 billion. The financial reserve provides room for the transformation, but its sustainability is linked to future cash generation. [3]
The Pace Program’s Savings Also Come at a Cost
For fiscal 2027, Nike expects revenue to decline in the high-single-digit percentage range and adjusted diluted earnings per share of $1.15 to $1.35. The outlook excludes approximately $0.15 per share in costs related to the Pace program. According to management, the transformation is expected to deliver cumulative savings of approximately $2.5 billion by fiscal 2031. The company also expects additional pre-tax costs of around $1 billion, on top of $0.3 billion in severance costs recognized in fiscal 2026. It plans to reinvest part of the savings. The cumulative $2.5 billion figure therefore does not represent an annual increase in operating profit. Adjustments to the supply chain and organizational structure may improve efficiency; the economic benefit will ultimately be determined by revenue, realized prices, and the extent of reinvestment. Nike is expected to present more detailed targets at its November investor day. [4]
Conclusion
Nike’s latest results indicate different rates of operating and commercial recovery. Logistics savings are improving gross margin, but lower revenue continues to weaken gross profit in absolute terms. Growth in wholesale sales in North America points to a recovery in distribution. The decline in direct sales, however, does not yet allow an equally strong turnaround in purchases by end customers to be confirmed. In China, the decline in the number of pairs of footwear sold points to a persistent volume problem. These differences limit the informational value of the Pace program’s savings targets alone. For the share valuation, it will be important whether the margin improvement begins to translate into growth in absolute gross profit and free cash flow. Key indicators will be volumes sold, discount trends, and inventory levels. The November investor day may provide greater detail on the transformation timetable, but financial results will continue to depend on consumer demand and the competitive environment. [5]
* Past performance is not a guarantee of future results.
[1,2,3,4,5] Forward-looking statements are based on assumptions and current expectations that may be inaccurate, or on the current economic environment, which may change. Such statements are not a guarantee of future performance. They involve risks and other uncertainties that are difficult to predict. Results may differ materially from those expressed or implied in any forward-looking statements.
O.Z.I. Online Zone Investment Opportunities (OZIOS) is a registered trademark of APME FX TRADING EUROPE LTD, a Cyprus Investment Firm (CIF) supervised and regulated by the Cyprus Securities and Exchange Commission (CySEC) under CIF licence number 335/17, with registered address at Lophitis Business Center, Office 404, 4th Floor, 28 October Ave 249, Limassol 3035, Cyprus. Contracts for Difference are complex instruments and come with a high risk of losing money rapidly due to leverage. 77.44% of retail investor accounts lose money when trading Contracts for Difference with this provider. You should consider whether you understand how Contracts for Difference work and whether you can afford to take the high risk of losing your money.
[1] https://investors.nike.com/sec-filings/all-sec-filings/content/0000320187-26-000088/nke-20260531.htm
[2] https://about.nike.com/en/newsroom/releases/nike-inc-reports-fiscal-2027-first-quarter-results
[3] https://www.digrin.com/stocks/detail/NKE/price ; https://chartexchange.com/symbol/nyse-nke/historical/
[4] https://investors.nike.com/sec-filings/all-sec-filings/content/0000320187-26-000193/nke-20260831.htm
[5] https://investors.nike.com/sec-filings/all-sec-filings/content/0000320187-26-000193/nke-20260831.htm
[6] https://investors.nike.com/sec-filings/all-sec-filings/content/0000320187-26-000193/nke-20260831.htm
[7] https://about.nike.com/en/newsroom/releases/nike-inc-reports-fiscal-2027-first-quarter-results